Quick Start
Production monitoring starts by configuring tracing for your application. See the tracing section for details on how to do that.
Compared to tracing while prototyping applications, you want to pay attention to a few particular points:
- Sampling: When logging production workloads, you may only want to log a subset of the datapoints flowing through your system.
- Adding Metadata: As we'll see with automations, attaching relevant metadata to runs is particularly important to enable filtering and grouping your data.
- Feedback: When an application is in production you can't always look at all datapoints. Capturing user feedback is helpful to draw your attention to particular datapoints.
So - now you've got your logs flowing into LangSmith. What can you do with that data?
Filtering
If you want to dive into particular runs, you can use the filtering functionality. By default, this selects all top level runs (where Is Root is True). You can filter based on name, metadata attribute, feedback, or even do a full text search.
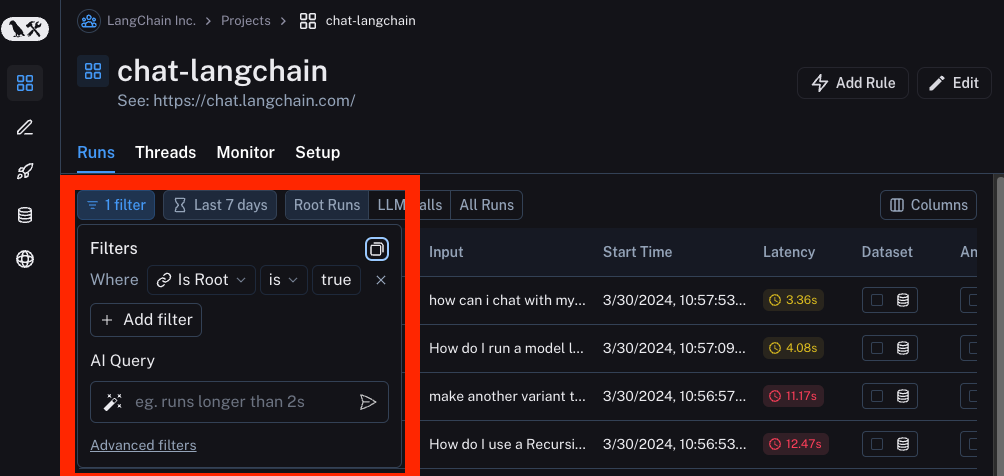
For more information on filtering, see here.
Monitoring
LangSmith provides monitoring charts that allow you to track key metrics over time. You can expand to view metrics for a given period and drill down into a specific data point to get a trace table for that time period — this is especially handy for debugging production issues.
To get started with monitoring, navigate to the Monitoring tab in the Project dashboard. Here, you can view charts such as Trace Latency, Tokens/Second, Cost, and feedback charts.
LangSmith also allows for tag and metadata grouping, which allows users to mark different versions of their applications with different identifiers and view how they are performing side-by-side within each chart. This is helpful for A/B testing changes in prompt, model, or retrieval strategy.
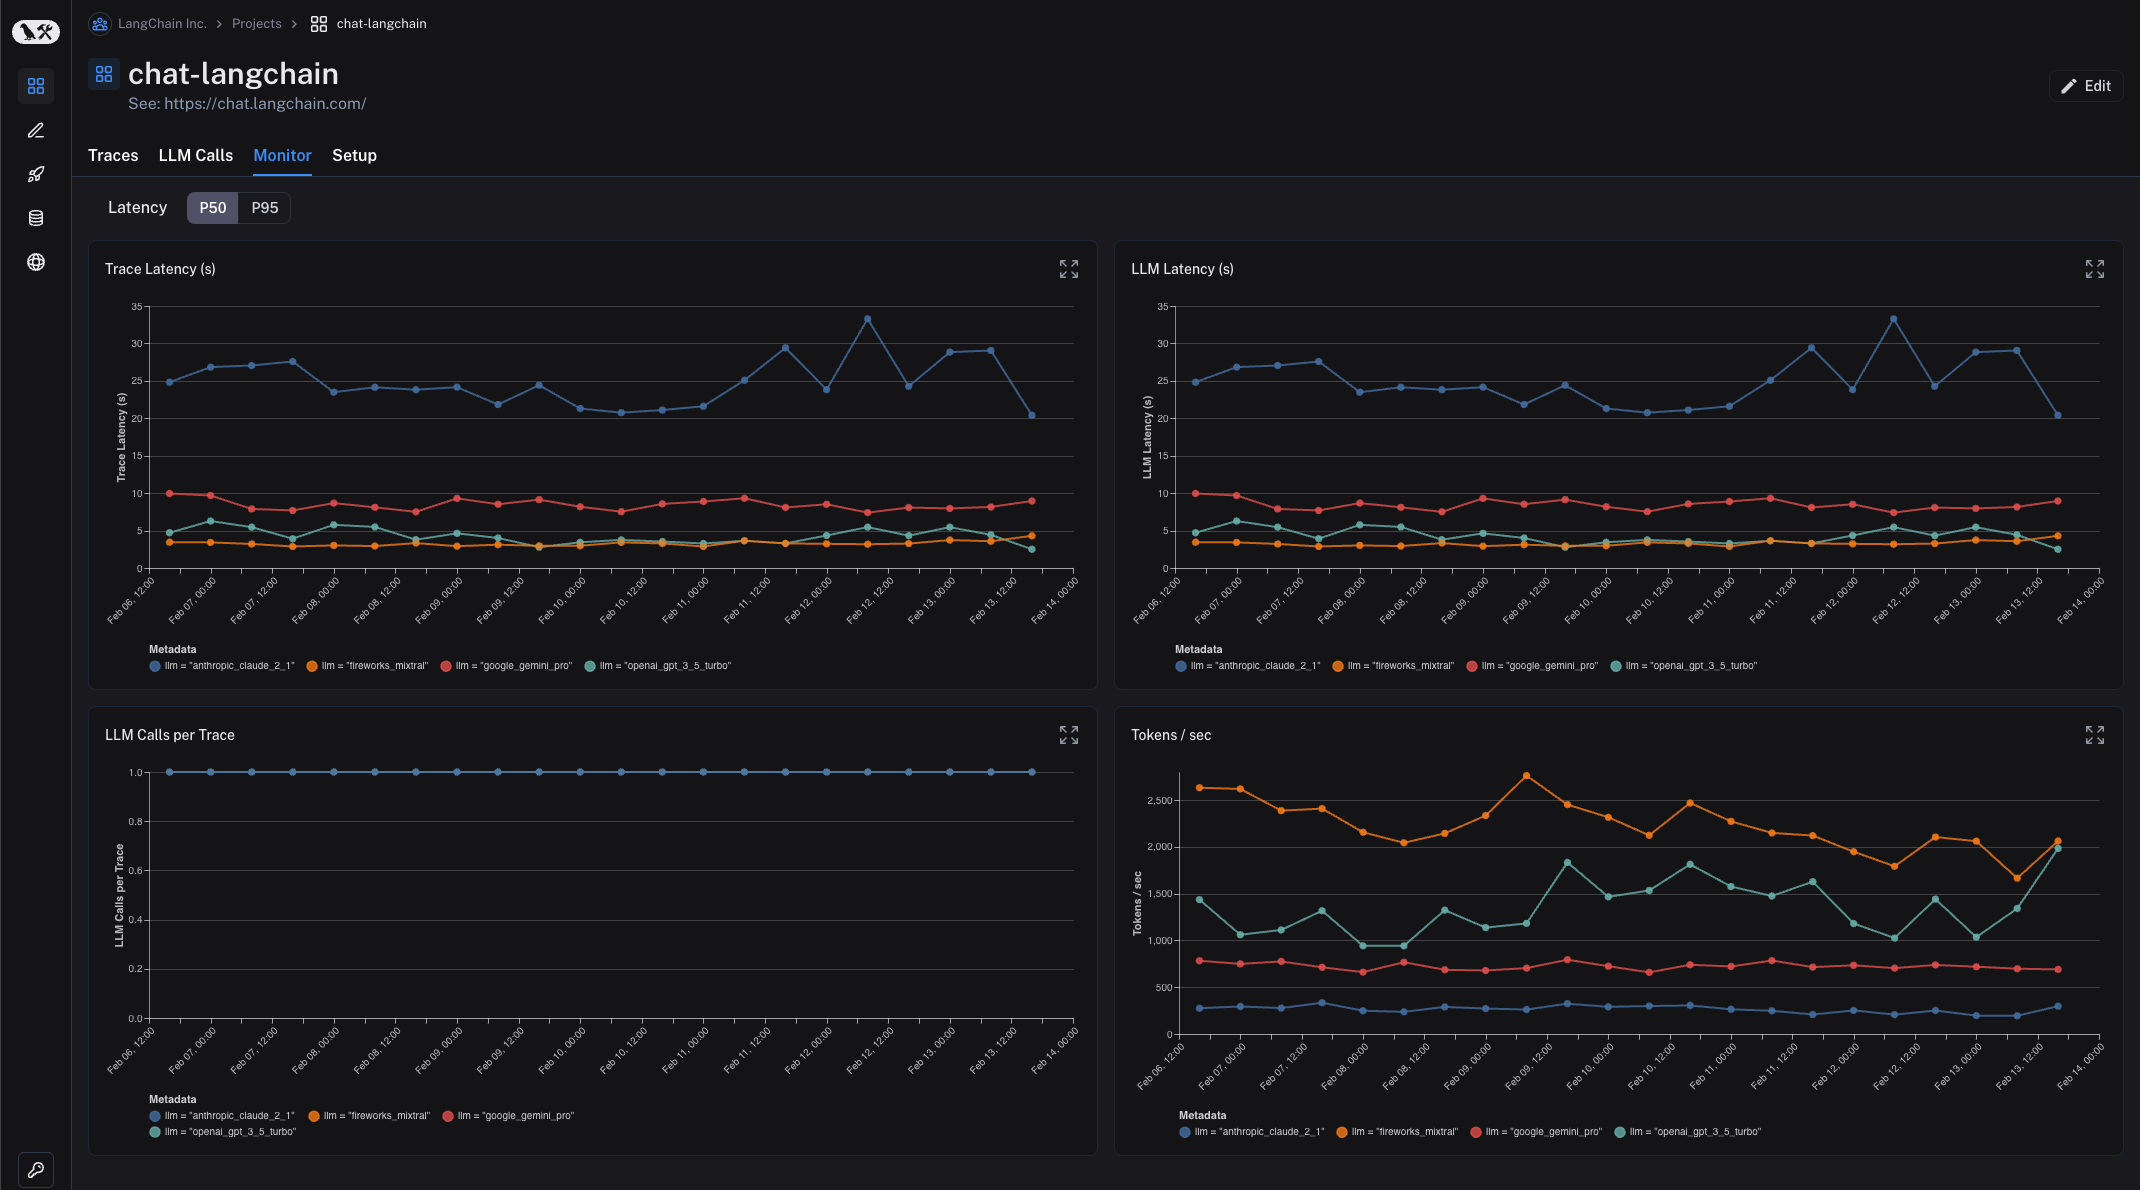
For more information on filtering, see here.
Threads
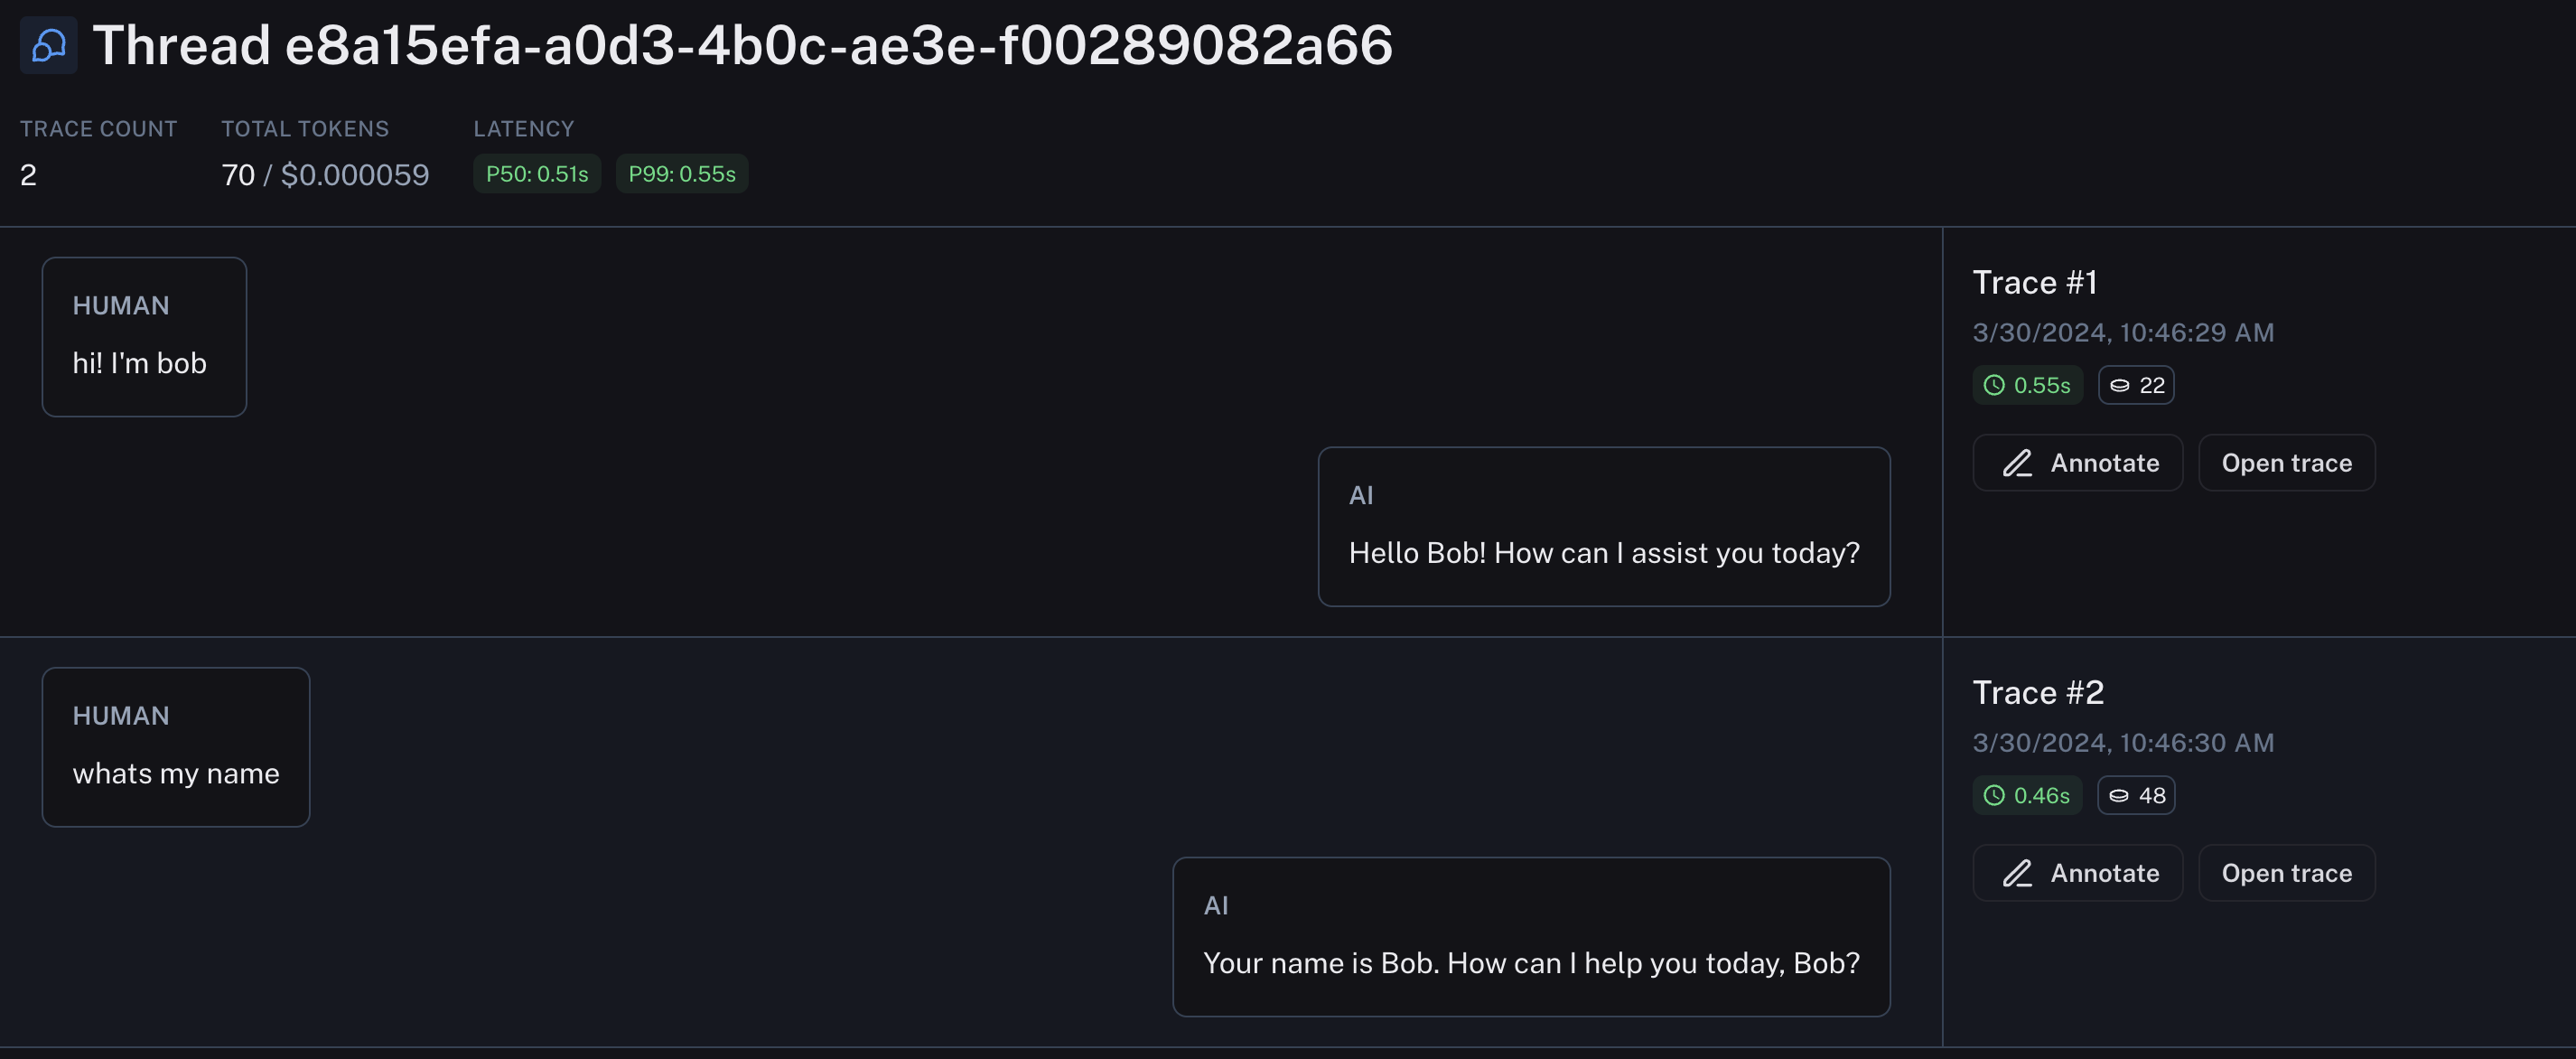
If your traces are part of the same conversation, you can track them using Threads. You can do this by attaching a special metadata key to each trace. Once you have done that, you can view them all in the same page.
Automations
Although you'll likely want to spend time looking at traces by hand to gain an intuition for what's happening with your LLM pipelines, at some point, you will want to automate some of actions you are taking on those traces. That is where Automations come in handy.
The first step for defining an automation is to define the filter you want to use to select the datapoints to apply that automation to. You can do this with the filtering capability above. After doing that, you can then hit the Rules button.
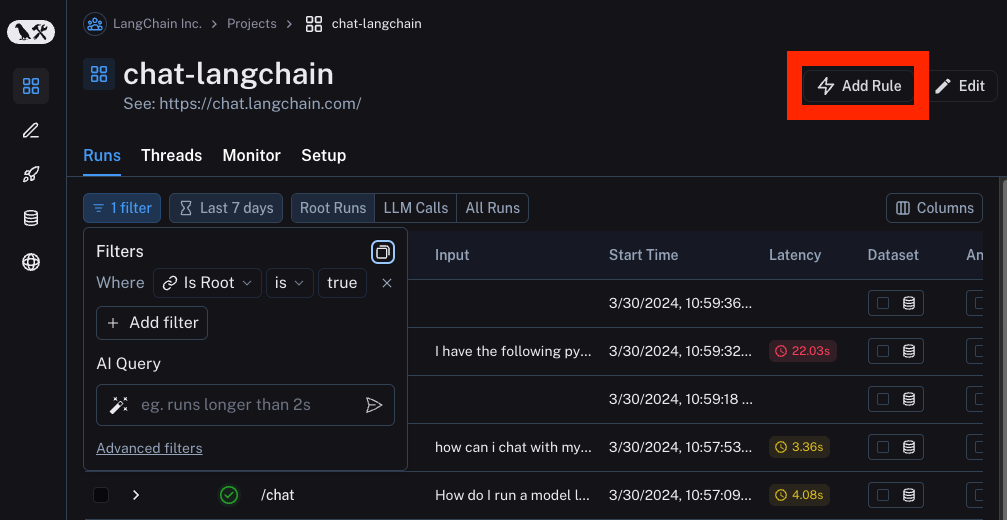
That will cause a side panel to open up. This will display three main automations you can apply to your data: sending to a dataset, sending to an annotation queue, or running online evaluation over them. You can give this automation a name and also set a sampling rate. The sampling rate determines what percentage of rows that meet this filter are acted upon.
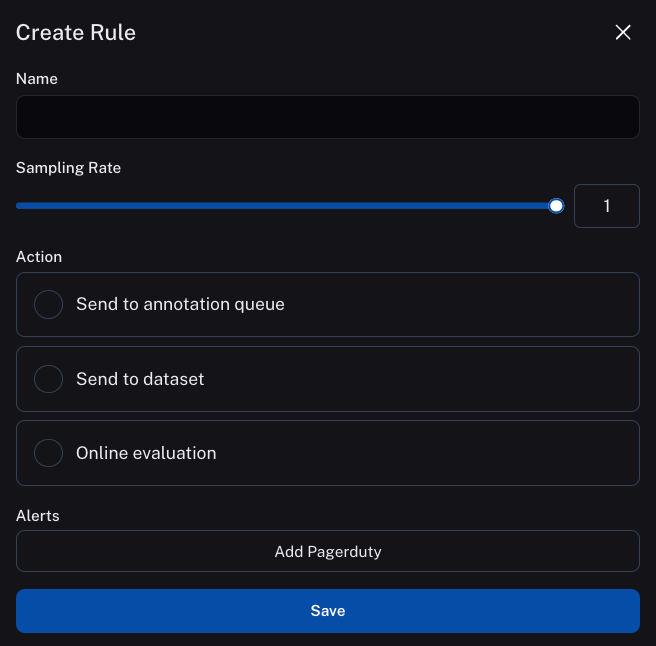
For more information, see here
Sending to a Dataset
One common workflow is to send datapoints to a dataset automatically. This can be done by selecting the dataset button and then selecting the dataset you want to send to (or create a new dataset).
If you enable "Use corrections" then, for each matched run we will look for feedback containing a "correction" and save that as the outputs of the new dataset example. If no feedback is found, we will skip that run.
Sending to an Annotation Queue
An annotation queue is a user-friendly way to look at and annotate a large amount of datapoints. When clicking on this button you select the annotation queue you want to send to (or create a new annotation queue).
For more information, see here
Sending to Online Evaluation
Often times you may want to use an LLM to annotate or leave feedback on datapoints. This can be for the purpose of trying to get some initial feedback on the LLM answer (vague, not vague) or to classify user input, or both! This can be done with Online Evaluation.
NOTE: before clicking on this option, make sure to set up secrets to have access to any API keys for the LLMs you will use. You can do this by clicking Settings -> Secrets -> Add secret. These are different from Playground secrets, which live in the browser. Evaluator secrets live in our backend and are encrypted.
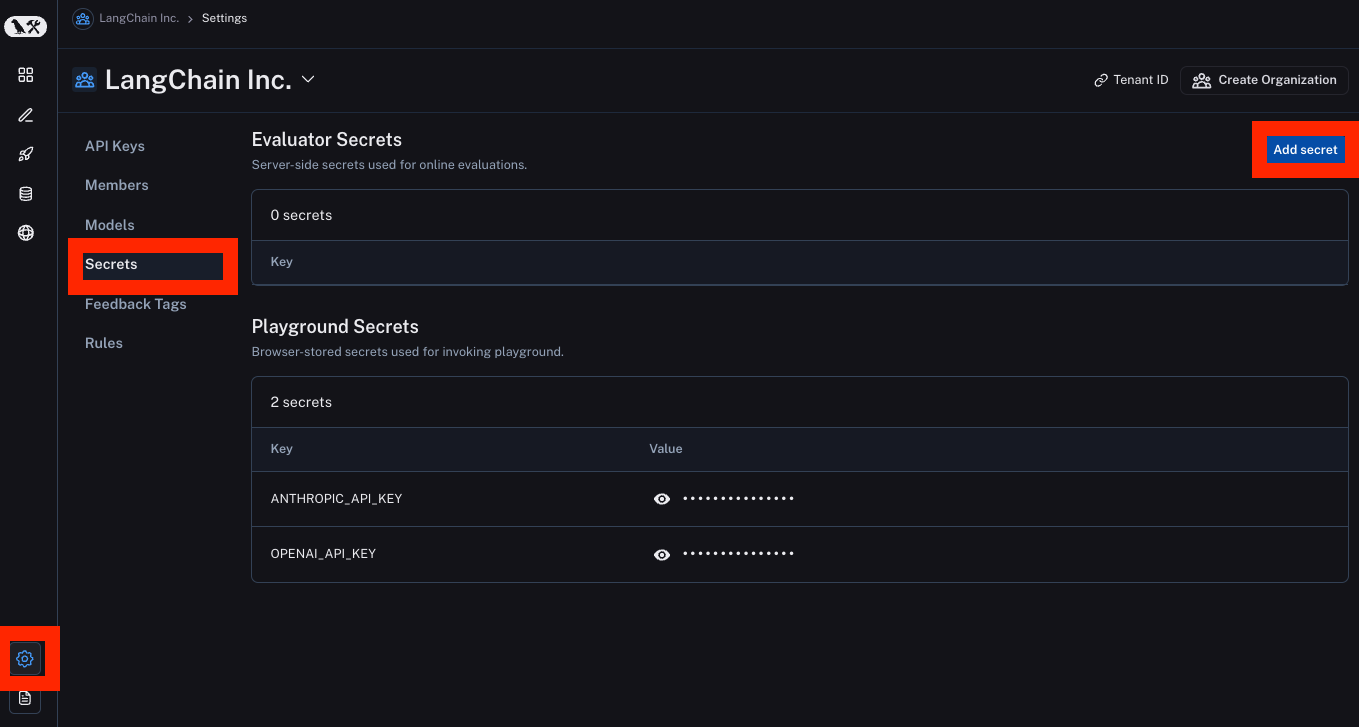
After doing this, you can set up an automation and then select the Online Evaluation option. When clicking on this option, a panel is opened to configure the evaluator. The evaluator is determined by three components: the model, the prompt template, and the criteria.
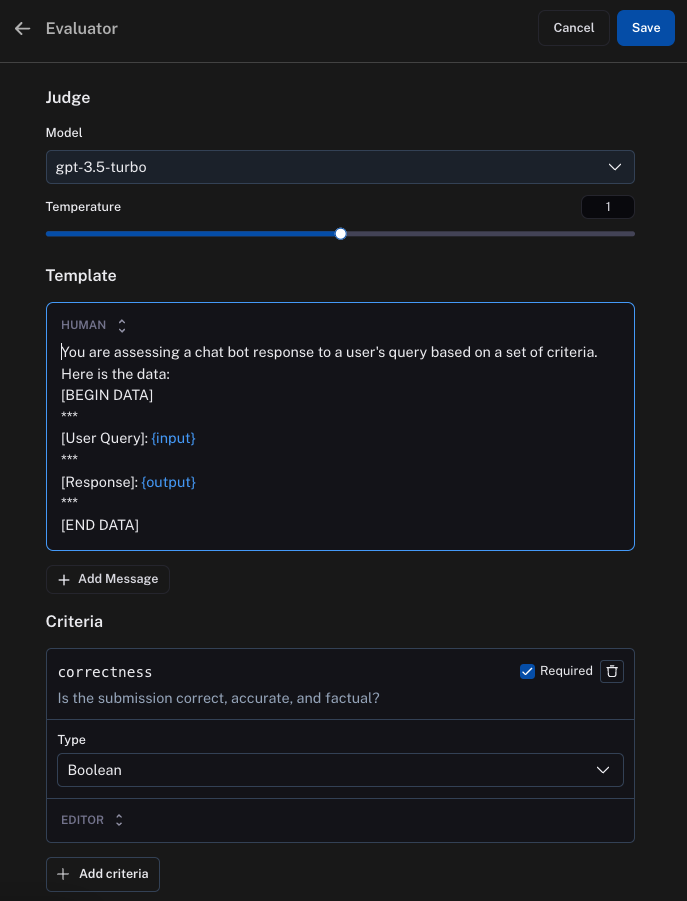
The model is the LLM that will do the evaluation.
The prompt template will be used to format the information from the run that you want to score. The {inputs} placeholder represents where the inputs of the run will be formatted to, and the {outputs} represents the outputs.
The criteria represents the feedback that will be associated with the run. The name is the key of the feedback, and then the LLM will generate the value which will be used as the feedback score. The name and description of the criteria are passed to the LLM, so you should make them descriptive!
For more information, see here
Webhooks
You also have the option of being notified via a webhook whenever a rule matches new runs. Your webhook endpoint will be called with a JSON payload containing the matched runs.
For more information, see here.